Ralliant (RAL)·Q4 2025 Earnings Summary
Ralliant Beats on Revenue and EPS Despite $1.4B Goodwill Impairment
February 4, 2026 · by Fintool AI Agent
Ralliant Corporation (NYSE: RAL) delivered Q4 2025 results that exceeded expectations on both revenue and adjusted earnings, though reported a massive GAAP net loss due to a $1.4 billion non-cash goodwill impairment charge. The newly spun-off precision technology company achieved its third consecutive quarter of sequential revenue growth, driven by strong demand in its Sensors & Safety Systems segment.
Did Ralliant Beat Earnings?
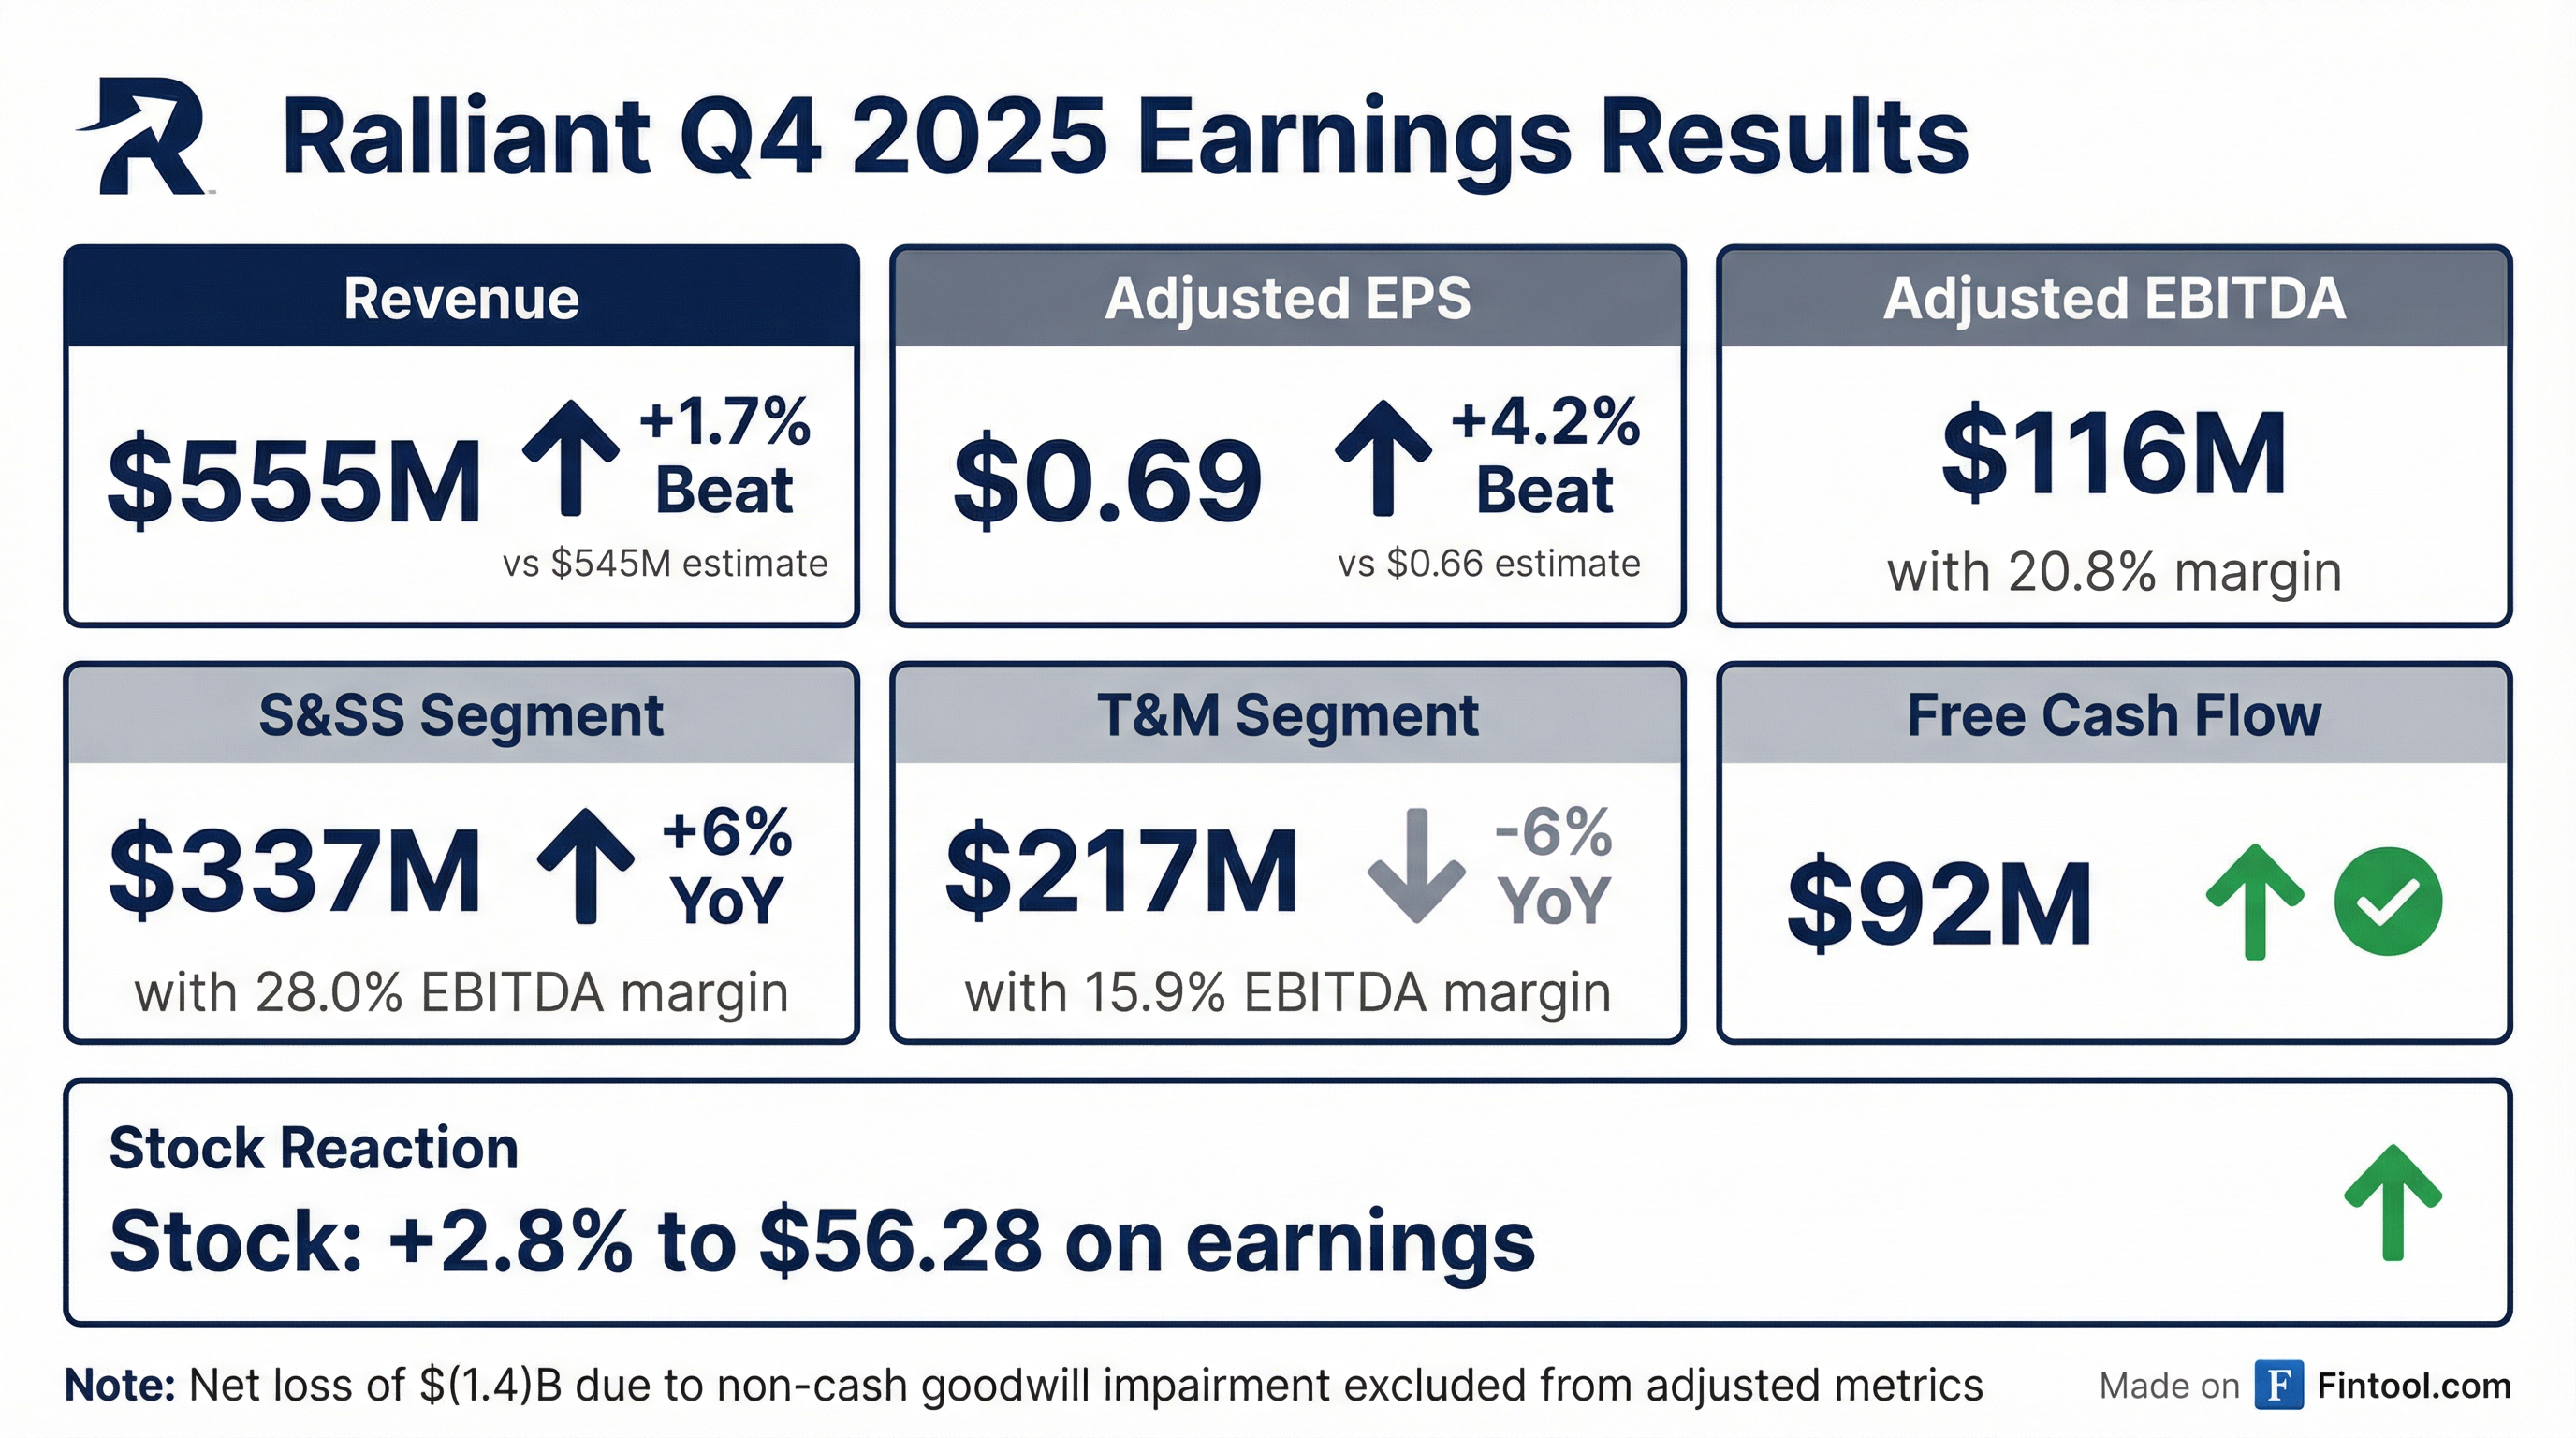
Yes — Ralliant beat on both revenue and adjusted EPS:
*Estimates from S&P Global
However, on a GAAP basis, Ralliant reported a net loss of $(1.4) billion, or $(12.10) per diluted share, driven entirely by a non-cash goodwill impairment charge.
Key Quote from CEO Tami Newcombe:
"Q4 marked the third consecutive quarter of sequential revenue growth, continuing the improvement we achieved throughout a pivotal year for Ralliant. Our disciplined execution amplified by continued deployment of the Ralliant Business System drove another strong quarter, with results at or above the high end of our guidance ranges."
What Happened With the $1.4 Billion Impairment?
The headline-grabbing loss stemmed from a $1.4 billion non-cash goodwill impairment charge recorded in the Test & Measurement segment.
Root Cause: The impairment was primarily driven by revised expectations for the EA Elektro-Automatik business, reflecting:
- Slower-than-anticipated business progression
- Recent reductions in industry forecasts for future electric vehicle (EV) adoption
The impairment charge has been excluded from all adjusted metrics as management believes the adjusted measures provide better insight into ongoing operations.
How Did the Segments Perform?
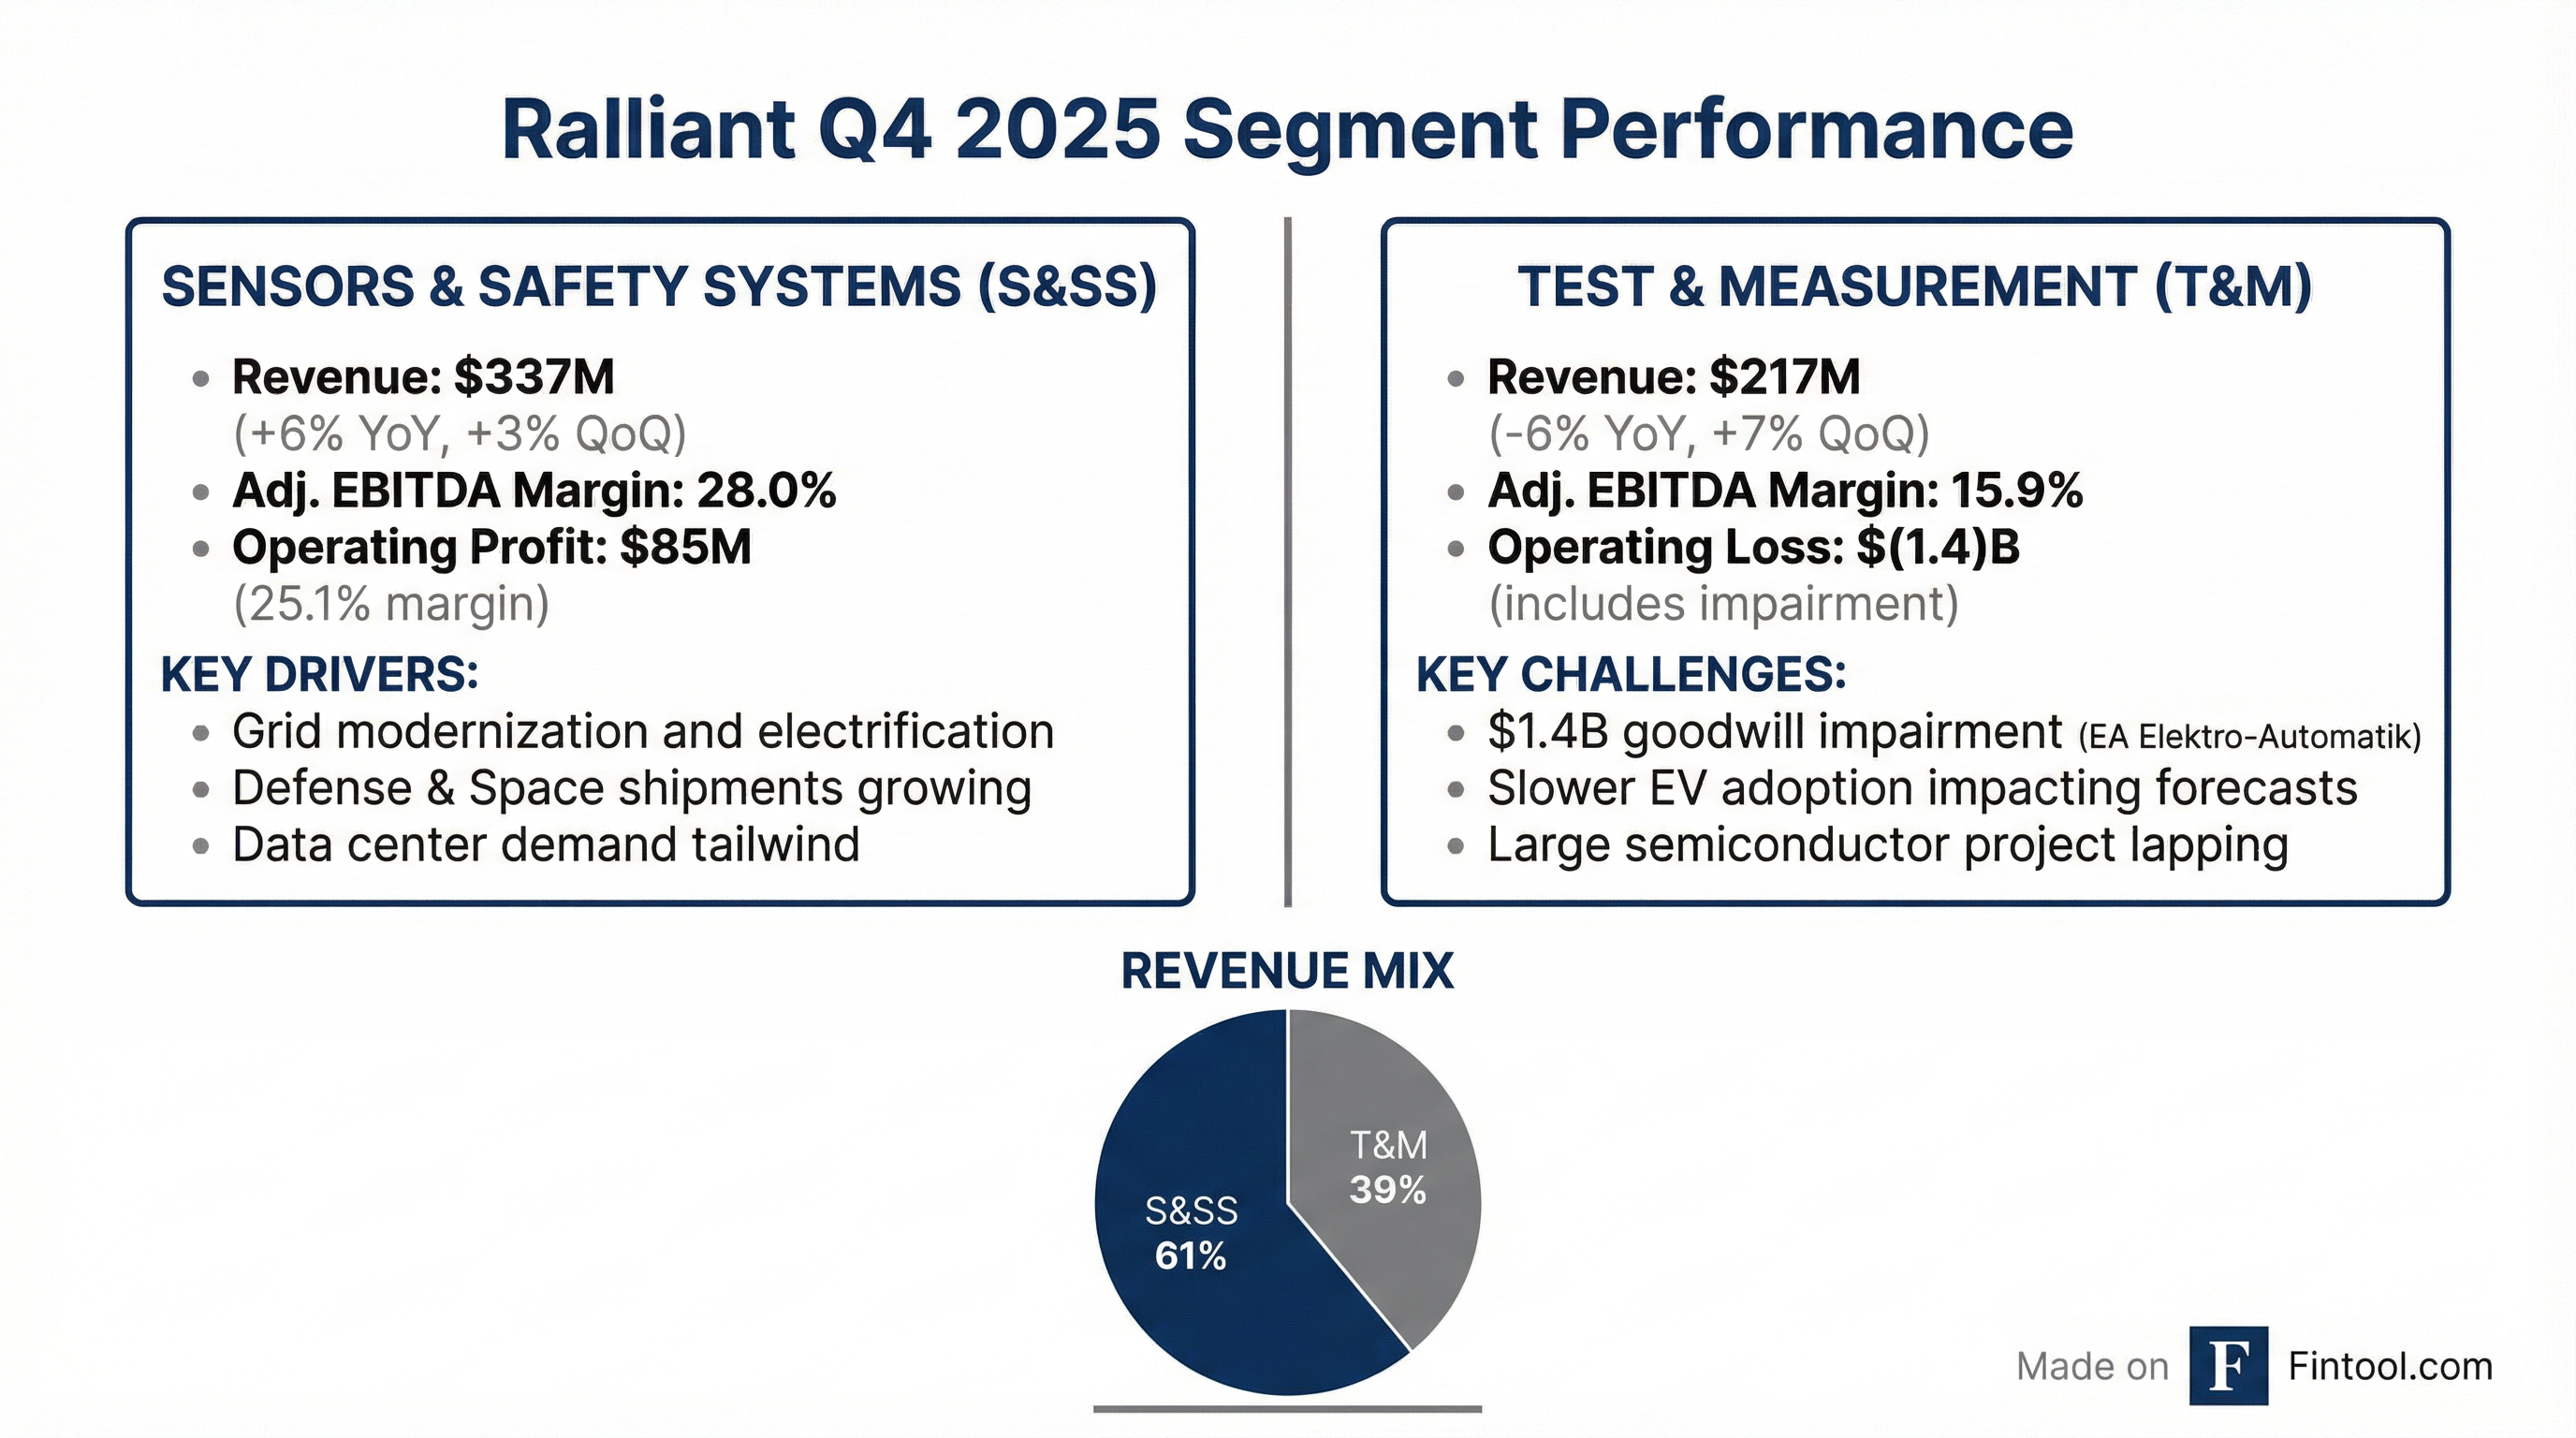
Sensors & Safety Systems (S&SS) — The Bright Spot
End Market Performance:
Growth Drivers:
- Grid modernization and expansion initiatives driven by electrification and data center demand
- Defense & Space revenue growth from robust demand and increased shipments; backlog continues to grow
- All end markets had mid-single-digit or better revenue growth
Margin Pressure: Operating profit margin declined primarily due to higher post-spin employee costs.
Test & Measurement (T&M) — Challenged by EV Headwinds
End Market Performance:
Challenges:
- Year-over-year revenue decline driven by lapping a large Semiconductor customer project that ended in Q3 2025
- The $1.4B goodwill impairment related to EA Elektro-Automatik's EV exposure
Positive Signs:
- Demand continued to stabilize, leading to +7% revenue growth sequentially
- Diversified Electronics stabilized broadly, up 10% Q/Q
- Communications surging +29% YoY on military/government demand
- Q/Q margin expansion of 200 bps driven by revenue growth and disciplined cost management
What Did Management Guide?
Q1 2026 Outlook
Full Year 2026 Outlook
Important: Management noted that excluding the pre-spin cost headwind, the guidance implies 40-45% incremental margins in 2026 on a like-for-like basis.
Cost Savings Program: On track for $9-11M annualized savings by end of 2026, with $4M annual run-rate already achieved in Q4.
Tariff Commentary: Assumptions based on policy announcements as of January 30, 2026; management expects to continue fully offsetting known tariff costs throughout 2026.
How Did the Stock React?
The stock gained 2.8% on earnings day, reaching its 52-week high of $57.02 intraday, reflecting investor confidence in the adjusted results despite the massive impairment charge. The muted after-hours decline suggests the market is appropriately discounting the non-cash nature of the goodwill writedown.
Balance Sheet and Capital Allocation
Capital Return Announcements:
- Quarterly dividend of $0.05/share declared January 29, 2026, payable March 23, 2026
- $200M share repurchase authorization remains fully available
Management's capital allocation priorities include organic reinvestment, return of capital, and selective tuck-in acquisitions.
Full Year 2025 Summary
What is Management's Growth Strategy?
Management outlined three strategic investment priorities to fuel above-market growth:
Key investments highlighted include:
- Record product launch year in 2025, with continued investment in new product innovation
- Increased capacity at PacSci EMC within existing footprint for Defense & Space demand
- Investment in digital commerce platform
- Building funnel of potential tuck-in acquisitions aligned with winning growth vectors
Investment Focus (from Q&A): Management clarified that 50-100 bps of reinvestment is baked into 2026 guidance at the company level. Investments are predominantly in Sensors & Safety Systems:
- Manufacturing: Expanding shifts, RBS productivity, standing up second lines and buying equipment for 2027-2028 capacity
- Sales Resources: Growing direct sales, augmented by AI and digital platforms
- Innovation Platforms: Arc detection AI for Qualitrol operators to improve grid reliability
What Changed From Last Quarter?
The sequential improvement demonstrates continued execution despite the EV-related impairment concerns. Management highlighted that the Ralliant Business System is driving operational improvements across both segments.
Key Risks and Concerns
-
EV Market Exposure: The $1.4B impairment signals significant concerns about EA Elektro-Automatik's outlook as EV adoption forecasts decline
-
T&M Segment Pressure: Revenue down 15% FY-over-FY with margin compression; semiconductor customer concentration risk
-
Margin Headwinds: FY26 guidance includes ~250 bps headwind from lapping lower pre-spin operating costs
-
Debt Load: $1.15B in debt on a ~$6B market cap company; paid $34M to Fortive in Q4 and $1.15B in separation consideration during 2025
-
Tariff Uncertainty: While management expects to offset known tariffs, policy risk remains elevated
Management's Key Takeaways
Management emphasized three key themes heading into 2026:
-
Pivotal 2025: Refined long-term strategy, ramped innovation, and enhanced growth culture while executing with discipline
-
Consistent Execution: Since launching as a public company, delivered quarterly performance at or above financial guidance and converted FCF significantly above long-term target
-
Strong 2026 Setup: Entering 2026 with strong secular tailwinds and strategic clarity on growth investments in commercial, innovation, and manufacturing
Q&A Highlights
Order Trends and Book-to-Bill
Management reported a 1:1 book-to-bill in the T&M products business, with sales funnels building as direct sellers work with semiconductor and aerospace/defense customers. Distribution partners are signaling strong quoting activity and normalized inventory levels.
Regional Performance
Qualitrol Hyperscaler Win — A New Customer Segment
CFO Neil Reynolds and CEO Tami Newcombe highlighted that Qualitrol's cloud provider win represents a third customer segment beyond traditional utilities and transformer OEMs. Hyperscalers are now directly building their own grid infrastructure for data centers — a new addressable market for Qualitrol's condition-based monitoring solutions.
Tektronix MP5000 — Greenfield Opportunity
The MP5000 platform launched in Q4 is Tektronix's first purpose-built solution for automated testing. Management noted this opens a new go-to-market with system integrators and represents greenfield opportunity in the validation space where Tektronix historically has small share.
Growth Investment Payoff Timeline
When asked about returns on organic investments, CEO Newcombe stated that while some benefit is embedded in 2026 guidance, investment payoff will predominantly occur in 2027.
"We have embedded the goodness in those investments into the guide for 2026. And, you know, there's always room to overdrive, especially on sales resources, if they can come online faster. But predominantly, that investment will be in 2027, will pay off in 2027."
OpEx Run-Rate Clarification
CFO Reynolds clarified that adjusted OpEx run-rate is $175M/quarter (excluding amortization), higher than the $170M previously communicated. This is the jump-off point for 2026 modeling, with only a modest increase expected ($700-720M full year).
S&SS Margin Mix Dynamics
When asked about sequential margin decline in S&SS despite higher revenue, management explained that PacSci EMC's record revenue came at a lower margin profile than segment average. For 2026, expect mid-to-high 20s EBITDA margins in S&SS given defense strength (lower margin) plus organic investment.
T&M End Market Breakdown
Q1 Margin Step-Down Drivers
CFO Reynolds explained the ~330 bps Q4-to-Q1 margin decline at midpoint:
- Seasonal revenue step-down (Q1 is typically lowest quarter)
- Compensation true-ups at start of year
- Initiation of organic investments
- Healthcare cost inflation
EA Elektro-Automatik Impairment Context
Management confirmed the impairment was triggered by EV subsidy changes and subsequent write-downs at auto OEMs (who are EA customers). The technology remains applicable to other energy storage applications, which is where the business is now being redirected.
Analysis generated from Ralliant's Q4 2025 8-K filing, press release, earnings presentation, and earnings call transcript dated February 4-5, 2026.
Related: